VISSEQ: Variant In Situ SEQuencing
VIS-seq is now preprinted! https://www.biorxiv.org/content/10.1101/2025.07.03.663081v1
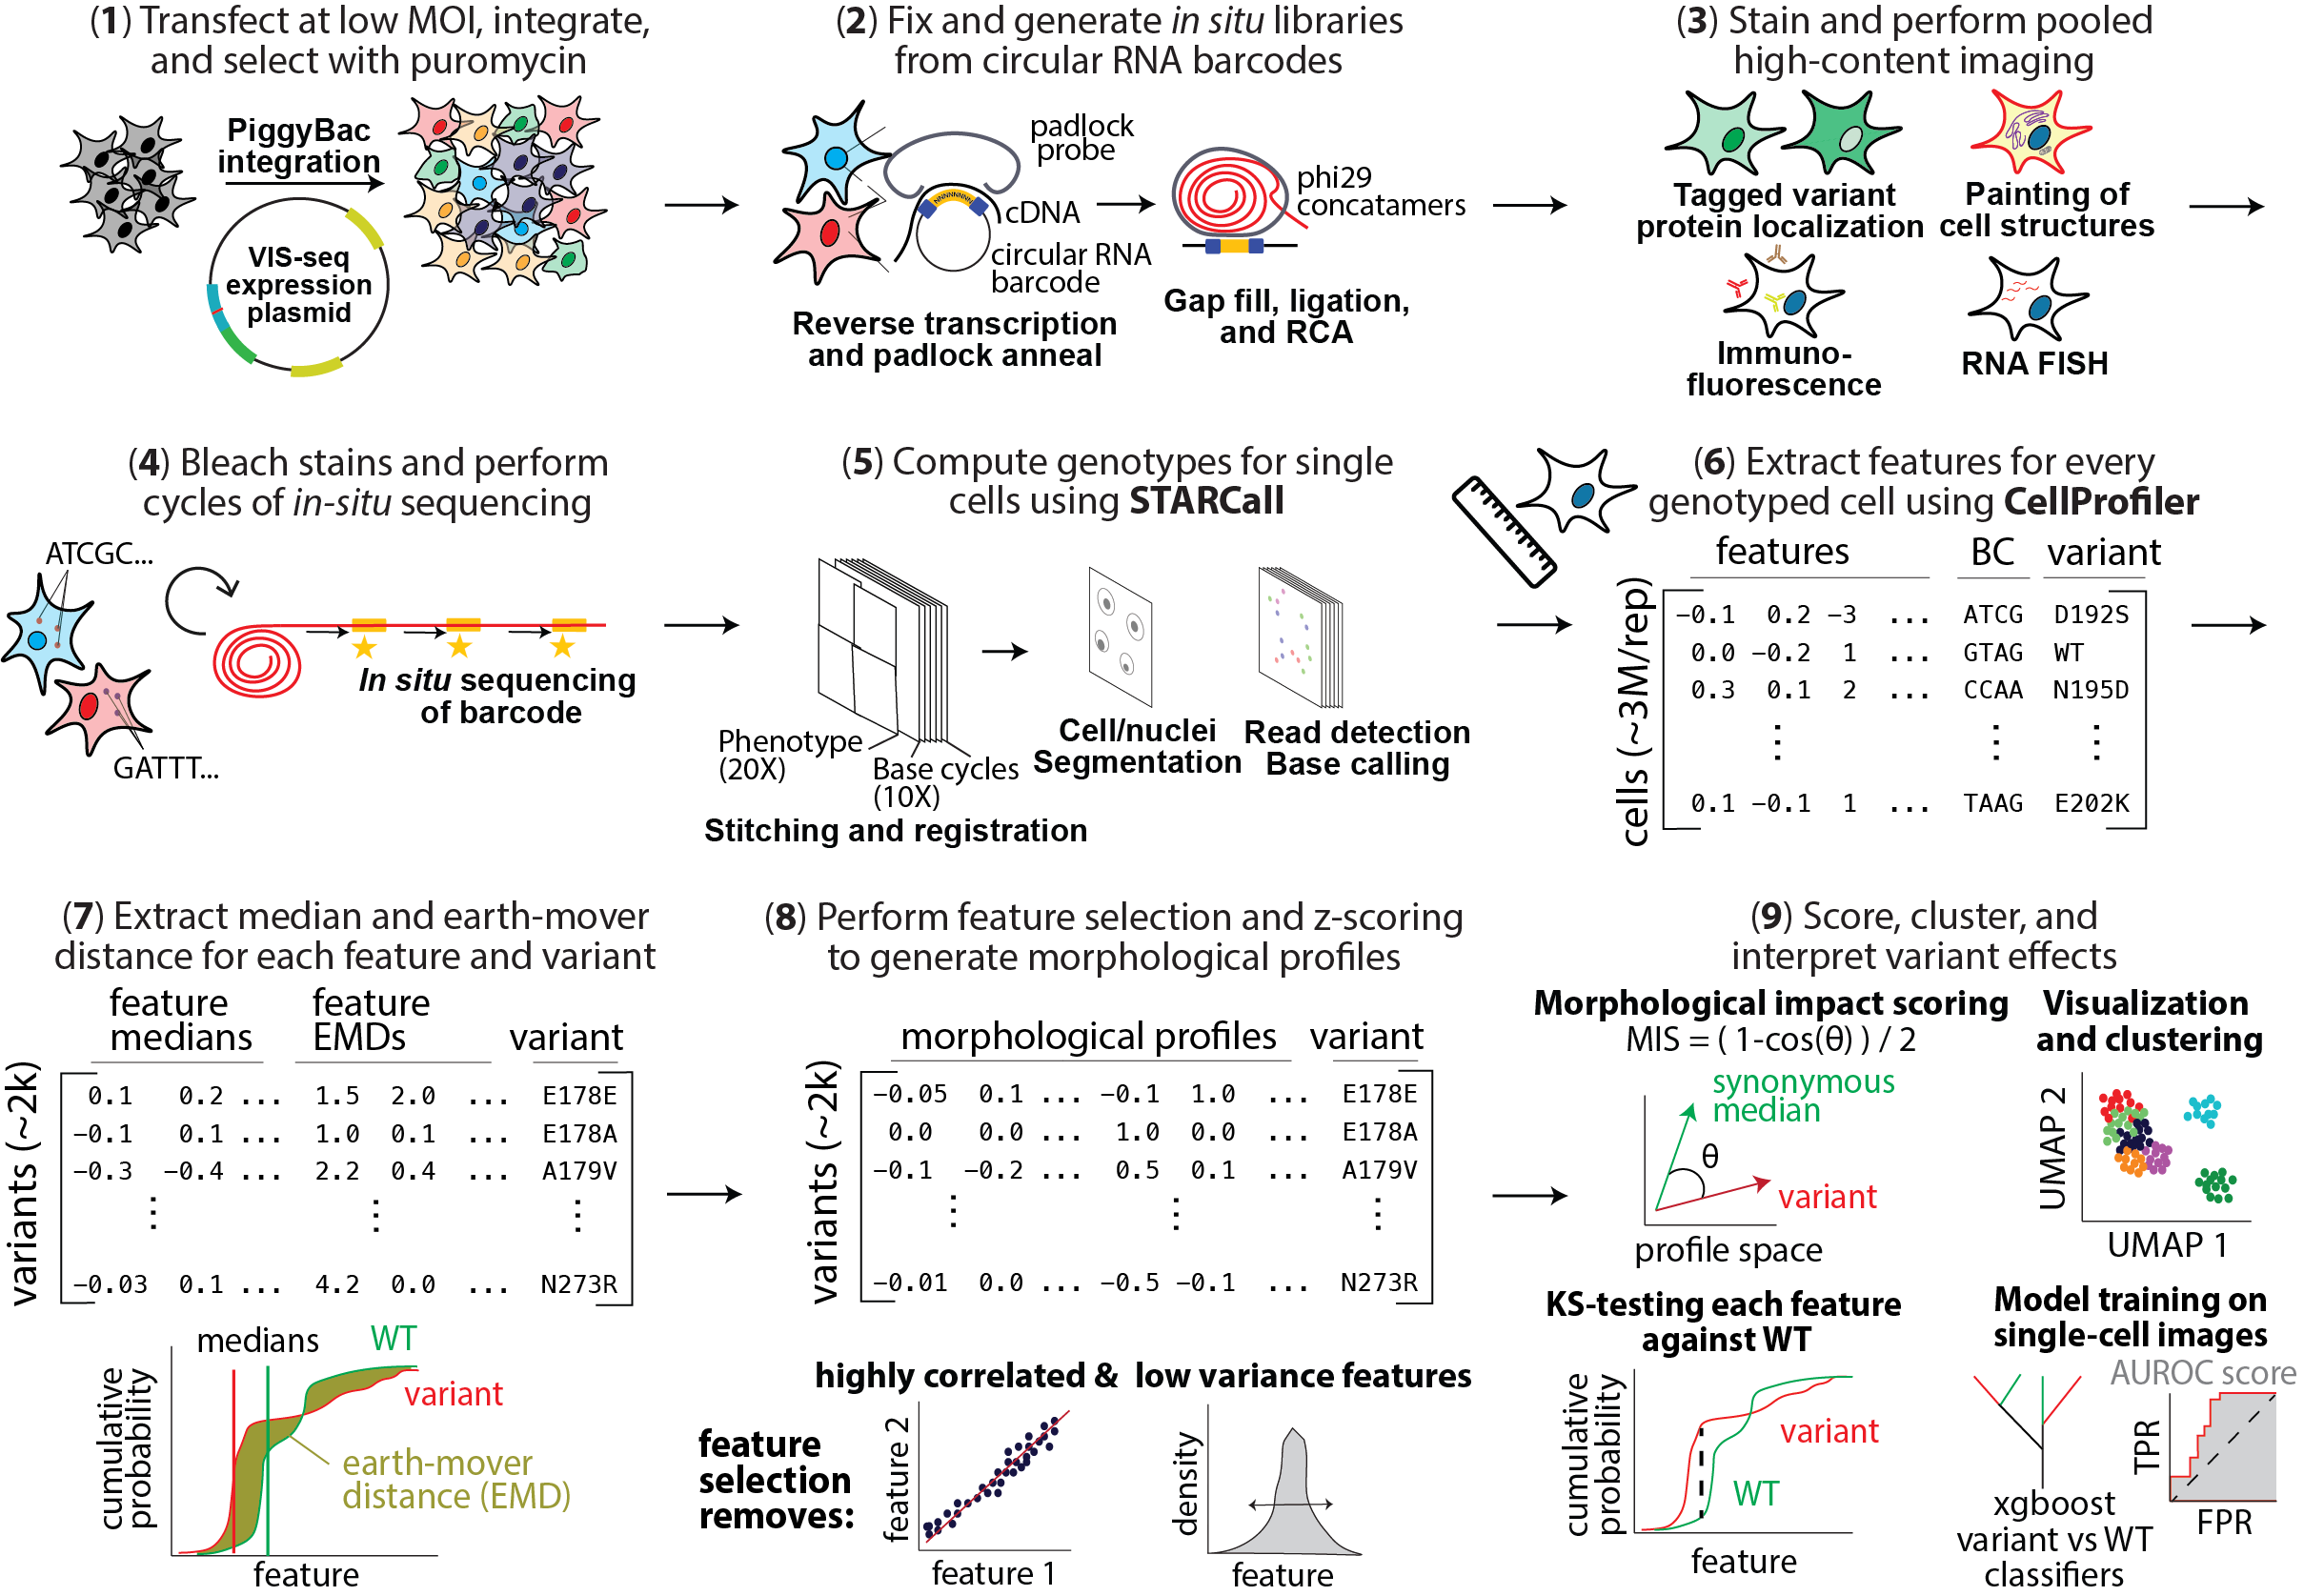
Variant in situ Sequencing (VIS-seq) is a platform for optically profiling thousands of transgenically expressed protein-coding variants simultaneously. VIS-seq comprises a cassette with a promoter expressing a circular RNA containing one or more barcodes that are sequenced in situ to reveal the identity of the variant expressed in each cell and a second promoter expressing the protein variant. We used VIS-seq to create morphological profiles comprising a large set of measurements of the intensity, distribution and shape of different markers for >3,000 variants of lamin A and PTEN from ~11.4 million cell images. Lamin A variants were expressed in U2OS cells and PTEN variants in either iPS cells or derived neurons.
Website navigation and usage
The website has a tab for each experiment performed, and each tab is divided into two main columns. The left side contains a UMAP scatter plot with all variants represented as points, as well as cell images for each variant that has been selected. The right side contains a heatmap and histogram showing all selected feature values for variants. Changing the selection of variants or features using the checkboxes and search bar at the top of the page will change the plots that are displayed. Below specific aspects of the website have been annotated:
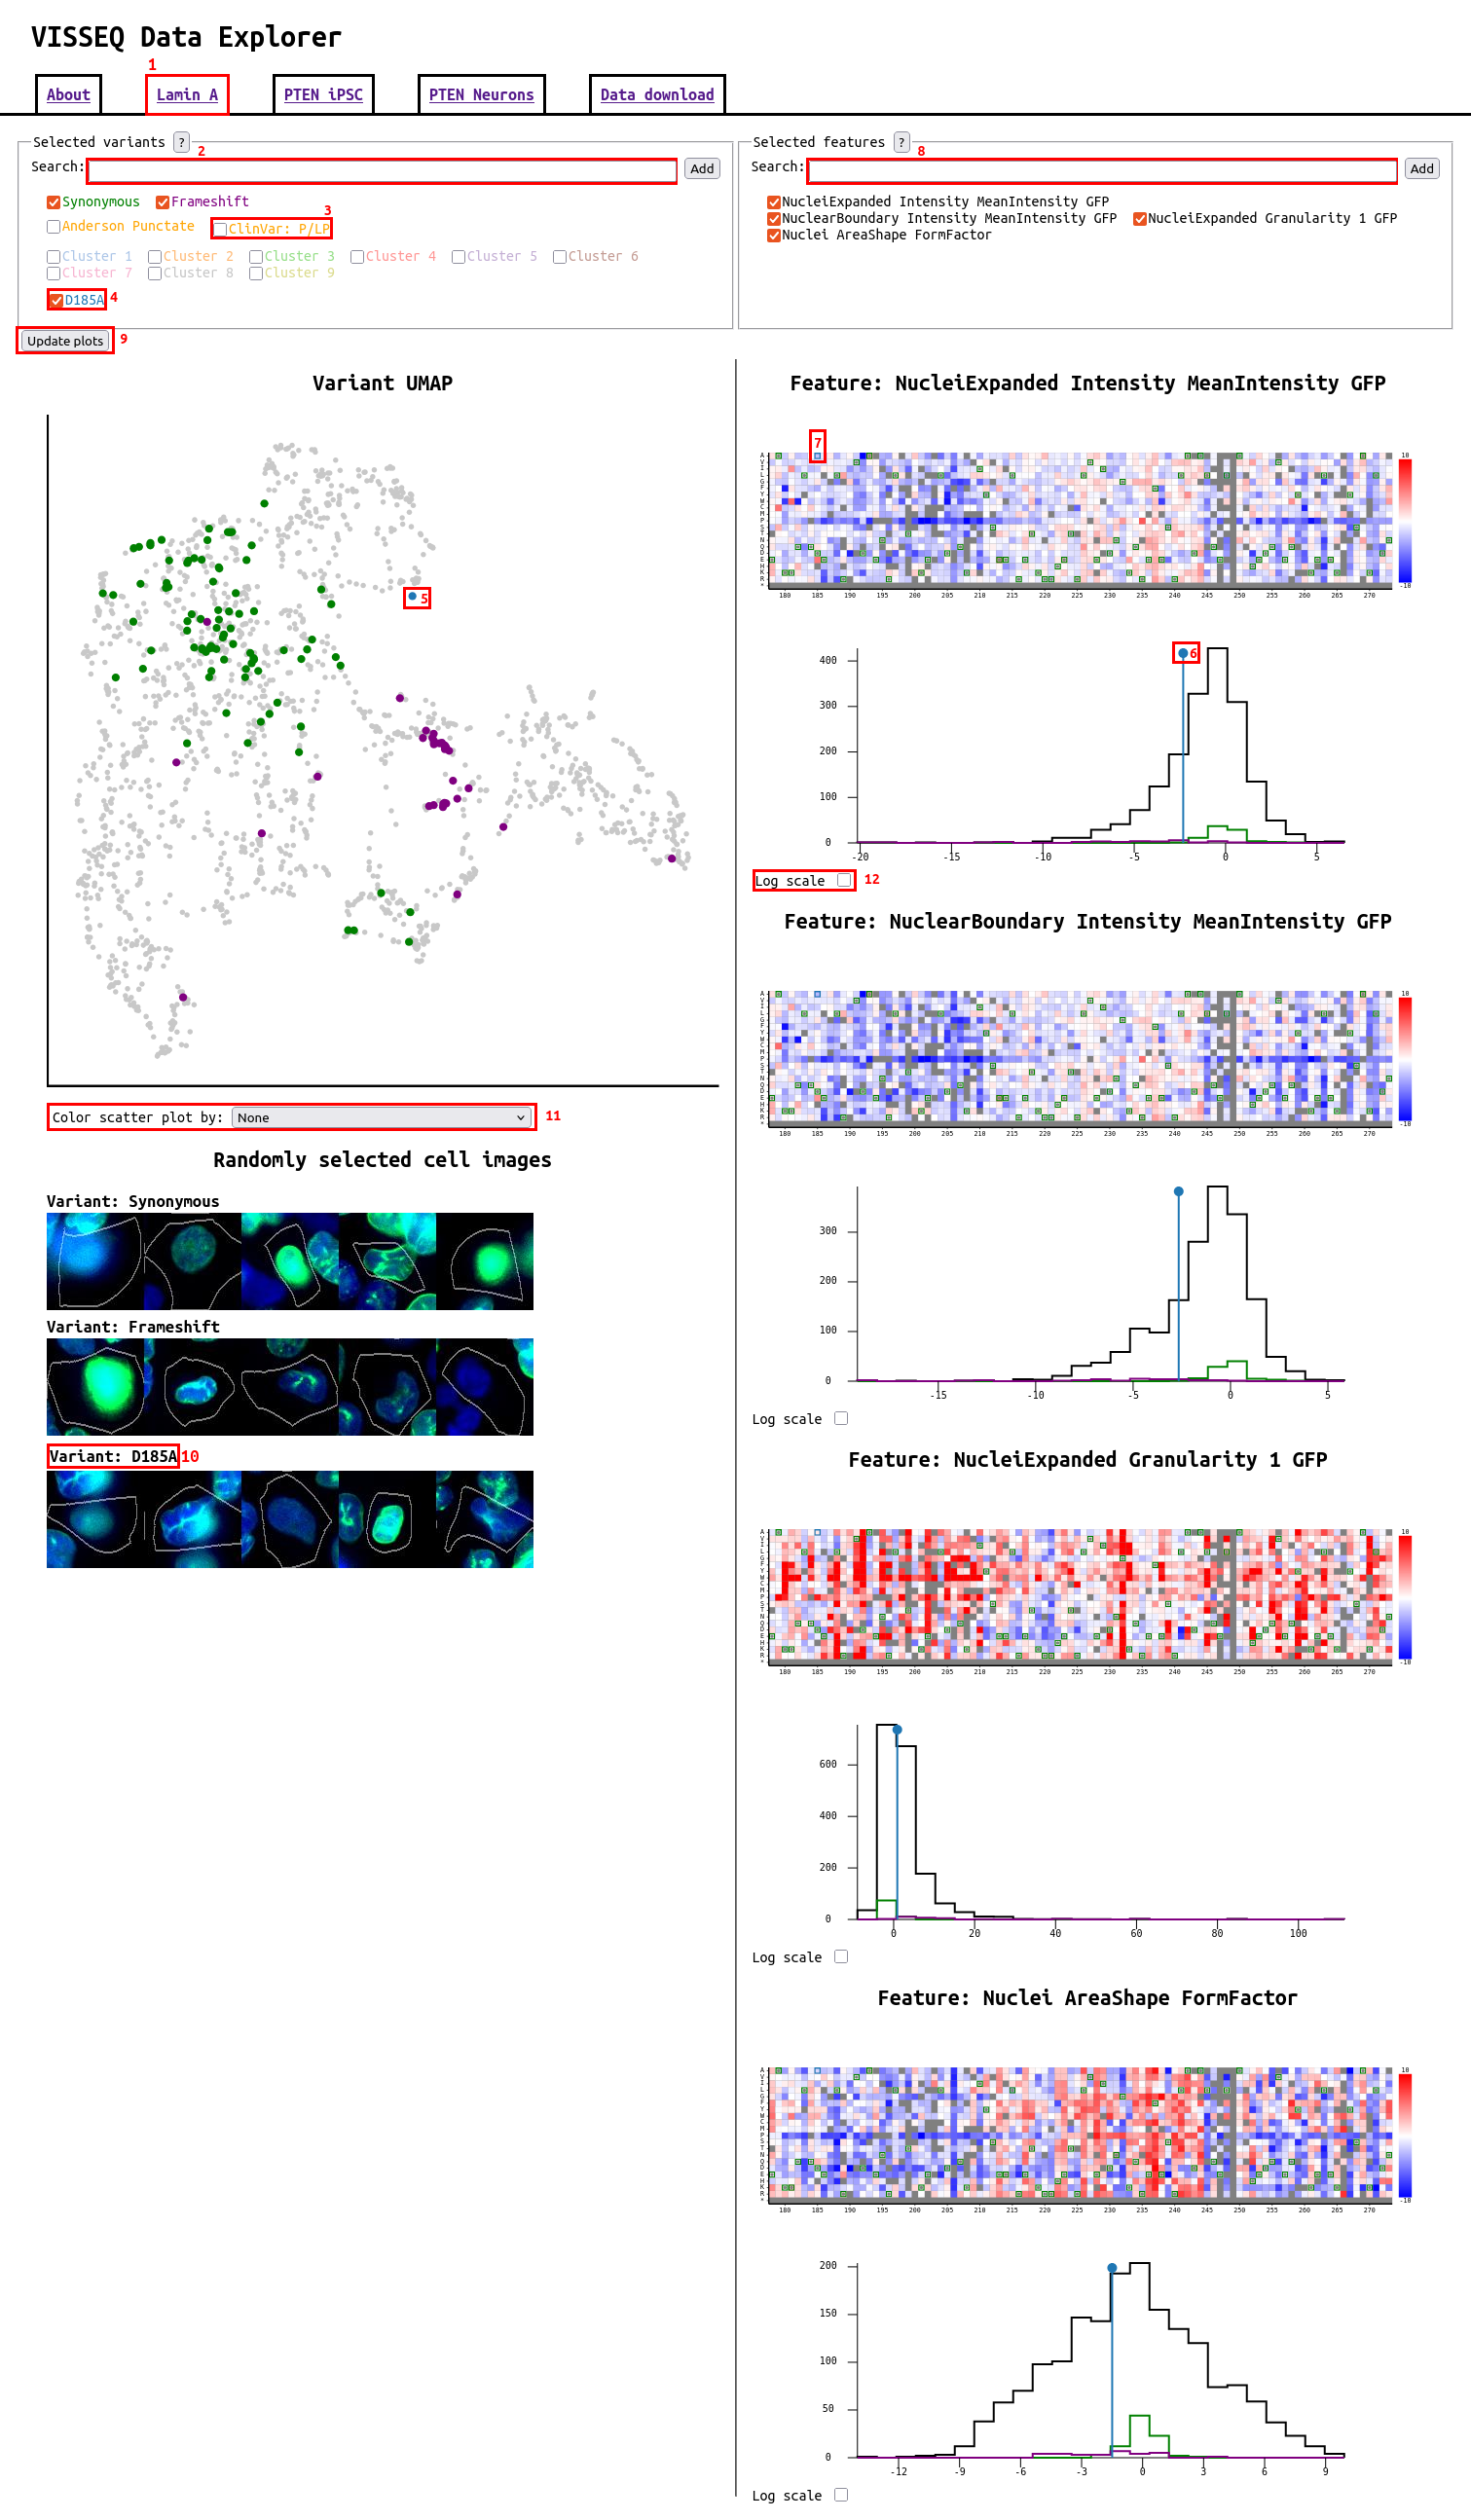
- Tabs to select different experiments. PTEN is separated into the iPSC and neuron experiments
- Search for variants. When typing a drop down with variants that match the current search query will pop up. Clicking on the drop down will fill in the full variant name. To add a variant that has been typed manually or selected from the drop down, click the "Add" button or press enter.
- Default variants or variants that have been added are displayed in the legend below the search bar, selecting the checkbox next to each one selects the variant. When selected, the variant will be highlighted with its given color in all plots below. In addition to variants, there are many groups of variants that can be selected, such as clinical variant controls, variant types, clusters.
- Individual variants that are selected from the search bar or by clicking on the plots will show up here
- In the scatter plot variants that have been selected will be colored matching their color in the legend. Clicking on specific points in the scatter plot will also select variants.
- Variants and variant groups are highlighted in the histogram for each feature. Single variants are shown as a vertical line and variant groups are shown as a histogram.
- Selected variants are highlighted in the heatmap, and by clicking on a box additional variants can be selected.
- Additional features can be searched for in the search box. Similar to variants, when typing features that match will be displayed in a dropdown below. Using this specific types of features can be searched for by typing "Cytoplasm" to see all cytoplasm features, or "GFP" to see all features from the GFP channel.
- The update plots button will be displayed if changes are made to the selection of variants or features. The selection of variants will update live, but to see plots for newly selected variants or features, this button needs to be pressed, which will reload the page.
- For each selected variant and variant group, select cell images are displayed, taken at random from all cells in the experiment. The images are colored where DAPI is blue, GFP or the protein of interest is green, and in the PTEN experiments pKAT is red. Clicking on the cell image will cause more images to be loaded.
- The UMAP plot is by default colored by the selected variants, but by changing this dropdown it can be colored by any of the selected features.
- The histogram can be changed to a log scale, which can make visualization of the smaller variant groups easier.